
Key takeaways
- By December 2024, Alchemy Pay’s price can reach a maximum of $0.0208 and an average trading value of $0.0196.
- By the end of 2027, the ACH price can reach a maximum of $0.0677 and an average of $0.0584.
- Alchemy’s price prediction for 2030 projects a maximum price of $0.1381.
Alchemy Pay (ACH) is a cross-functional payment solution that is making significant strides in bridging the gap between fiat and cryptocurrency ecosystems. The platform’s robust framework enables global consumers to connect with merchants, developers, and institutions worldwide, facilitating transactions across multiple fiat currencies and cryptocurrencies. This functionality enhances Alchemy Pay’s adaptability and positions it as a pivotal player in the financial technology sector.
Alchemy Pay’s inclusion in the decentralized platforms of popular projects like Augur, Cryptokitties, and OpenSea, along with its support for the infrastructure of Kyber and Radar Relay, adds layers of credibility and utility, enhancing its investment appeal.
Can Alchemy Pay (ACH) get to $0.1? Will ACH ever reach $1? Let’s find out in this ACH price prediction for 2024-2030.
Overview
| Cryptocurrency | Alchemy Pay |
| Token | ACH |
| Price | $0.0199 |
| Market Cap | $135,823,498 |
| Trading Volume | $4,050,370 |
| Circulating Supply | 8,084,070,898 |
| All-time High | $0.1975 Aug 06, 2021 |
| All-time Low | $0.001338 Jul 20, 2021 |
| 24-h High | $0.01984 |
| 24-h Low | $0.01798 |
Alchemy Pay price prediction: Technical analysis
| Price Prediction | $ 0.054871 (227.29%) |
| Volatility | 6.26% |
| 50-Day SMA | $ 0.020801 |
| 14-Day RSI | 39.28 |
| Sentiment | Bearish |
| Fear & Greed Index | 29 (Fear) |
| Green Days | 12/30 (40%) |
| 200-Day SMA | $ 0.026319 |
Alchemy Pay price analysis: ACH attains massive bullish momentum at $0.0199
TL;DR Breakdown
- ACH price analysis is bullish today.
- Resistance around the $0.01984 mark.
- Support for ACH is at $0.01798.
The Alchemy price analysis for September 19 shows an upward trend, starting from $0.01814 and steadily climbing to $0.0199. The price movement indicates a strong bullish momentum, with continuous buying pressure pushing the value higher. After an initial small dip, the price quickly recovered and has remained on a positive trajectory. The sustained upward movement suggests growing interest and demand, which could lead to further gains if the momentum continues.
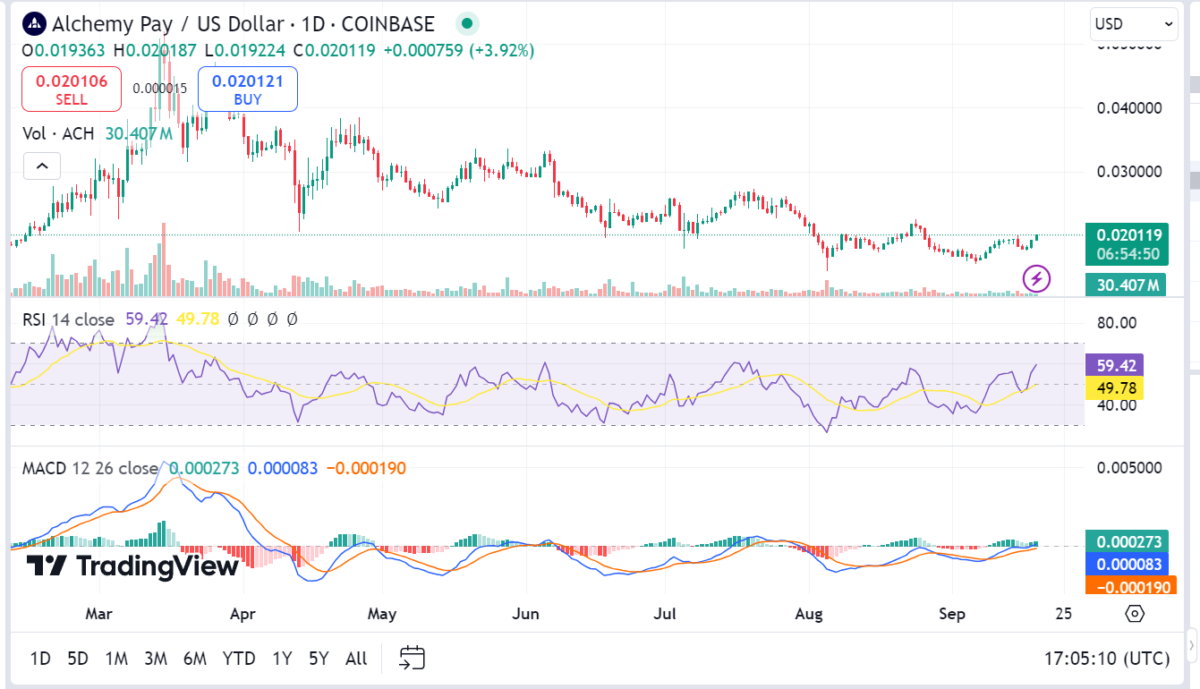
Alchemy Pay 1-day price chart: ACH shows recovery with 3.2% gains
In the 1-day timeframe, Alchemy Pay (ACH) shows a slight upward movement, with the price currently at $0.0199, reflecting a 3.20% increase. The price action indicates recovery, with the coin gradually climbing after a period of consolidation. Alchemy Pay has been hovering around this price range, showing signs of stability as it edges upwards.
The RSI is at 59.42, signaling that the asset is approaching the overbought zone, indicating increased buying interest. The MACD shows a bullish crossover, with the MACD line crossing above the signal line, suggesting a potential continuation of the upward trend.
Alchemy Pay 4-hour chart: Bulls continue to push price higher
The 4-hour Alchemy Pay price analysis also confirms that the price has been trading between the resistance at $0.01984 and the support at $0.01798. However, the bulls have been able to push for higher highs, indicating that they are gaining control over the market. The bulls have been able to hold onto the bullish momentum despite several attempts by the bears to push the price down.

The Relative Strength Index (RSI) for ACH/USD is currently at 68.08. This indicates that the coin is in the overbought zone, and that further upward movement is expected.The MACD shows a bullish signal with a positive crossover, suggesting ongoing upward momentum, supported by increasing buying pressure in the market.
Alchemy Pay technical indicators: Levels and Action
Daily simple moving average (SMA)
| Period | Value | Action |
| SMA 3 | $ 0.017586 | SELL |
| SMA 5 | $ 0.017095 | SELL |
| SMA 10 | $ 0.017841 | SELL |
| SMA 21 | $ 0.019155 | SELL |
| SMA 50 | $ 0.020801 | SELL |
| SMA 100 | $ 0.022924 | SELL |
| SMA 200 | $ 0.026319 | SELL |
Daily exponential moving average (EMA)
| Period | Value | Action |
| EMA 3 | $ 0.018786 | SELL |
| EMA 5 | $ 0.018886 | SELL |
| EMA 10 | $ 0.018973 | SELL |
| EMA 21 | $ 0.019616 | SELL |
| EMA 50 | $ 0.021425 | SELL |
| EMA 100 | $ 0.023532 | SELL |
| EMA 200 | $ 0.024656 | SELL |
Alchemy Pay price analysis conclusion
Alchemy Pay (ACH) has shown positive momentum in both the 1-day and 4-hour timeframes, with steady gains and an upward trend in price. The RSI in both timeframes is approaching the overbought zone, signaling strong buying interest but also suggesting potential short-term corrections. The MACD indicators support this bullish outlook, with positive crossovers indicating continued upward momentum.
Is Alchemy Pay a good investment?
Alchemy Pay (ACH) shows mixed signals as an investment. While the current bearish trend and volatility indicate short-term challenges, the solid market capitalization and consistent support levels suggest long-term potential. However, risk-averse investors may prefer to wait for clearer bullish signs or reduced volatility before considering ACH.
Will ACH recover?
ACH may recover if bulls regain control and maintain support above critical levels. While the current outlook remains bearish, a breakout above short-term resistance levels and consistent buying activity could reverse the negative momentum and lead to a potential recovery in the market.
Will ACH reach $0.05?
ACH is expected to trade above the $0.05 range throughout 2027, suggesting potential for significant price appreciation compared to earlier years.
Will ACH reach $0.1?
The price forecasts indicate that ACH could reach a minimum of $0.1186 by 2030. Given the projected positive market sentiment and growth trend, it is possible that ACH might reach $0.1 within the next six years.
Will ACH reach $0.3?
The predictions for 2030 show a maximum price of $0.1132 for ACH. While this indicates significant growth potential, ACH is unlikely to reach $0.3 by 2030 based on current forecasts.
Does ACH have a good long term future?
Alchemy Pay (ACH) shows a generally positive long-term outlook, with projected steady price growth over the years. By 2030, ACH is expected to increase substantially, indicating a good long-term future with moderate to strong growth potential.
Recent news/opinion on Alchemy Pay
- Alchemy Pay updates for September
Alchemy Pay price prediction September 2024
For September 2024, Alchemy Pay (ACH) is expected to exhibit a range of price movements. The potential low is projected to be $0.039, while the potential average price might settle around $0.036. On the higher end, ACH could reach up to $0.042.
| Month | Minimum price | Average price | Maximum price |
| Alchemy Pay price prediction September 2024 | $0.039 | $0.036 | $0.042 |
Alchemy Pay price prediction 2024
For 2024, Alchemy Pay (ACH) is anticipated to see varied price levels. The potential low is projected at $0.0187, while the average price could be around $0.0196. On the higher end, ACH might reach up to $0.0208. These predictions suggest a generally stable performance with moderate growth potential, indicating that ACH may experience slight fluctuations but maintain a steady upward trend throughout the year.
| Year | Minimum price | Average price | Maximum price |
| Alchemy Pay price prediction 2024 | $0.0187 | $0.0196 | $0.0208 |
Alchemy Pay price predictions 2025-2030
| Year | Minimum price | Average price | Maximum price |
| 2025 | $0.0263 | $0.0271 | $0.0328 |
| 2026 | $0.0388 | $0.0402 | $0.0459 |
| 2027 | $0.0568 | $0.0584 | $0.0677 |
| 2028 | $0.0568 | $0.0584 | $0.0677 |
| 2029 | $0.0811 | $0.0840 | $0.0967 |
| 2030 | $0.1132 | $0.1174 | $0.1381 |
Alchemy Pay price prediction 2025
According to the Alchemy Pay price forecast, the currency is predicted to trade at a floor price of $0.0263 in 2025. An overall positive sentiment in the crypto market could push ACH to a maximum price of $0.038 and an average price of $0.0271.
Alchemy Pay price prediction 2026
By 2026, analyst expect ACH to reach a maximum price of $0.0459. The projected average market price for the year is $0.0402. In the event of a bearish wave, the expected floor price is $0.0388.
Alchemy Pay price prediction 2027
In 2027, the price of Alchemy Pay is expected to range from a minimum of $0.0568 to a maximum of $0.0677, with an average trading price forecasted at $0.0584.
Alchemy Pay price prediction 2028
In 2028, Alchemy Pay forecasts the minimum price to reach $0.0568 and the maximum expected price to be $0.0677. On average, traders can anticipate a trading price around $0.0584 throughout the year.
Alchemy Pay price prediction 2029
In 2029, Alchemy Pay (ACH) is anticipated to achieve a minimum price of $0.0811. The cryptocurrency could potentially reach a maximum value of $0.0967, with an average price expected around $0.0840 during the year.
Alchemy Pay price prediction 2030
By 2030, analyst expect ACH to reach a maximum price of $0.1381. The projected average market price for the year is $0.1174. In the event of a bearish wave, the expected floor price is $0.1132.

Alchemy Pay market price prediction: Analysts’ ACH price forecast
| Firm | 2024 | 2025 |
| Gate.io | $0.0173 | $0.020 |
| SwapSpace | $0.010 | $0.013 |
| AmbCrypto | $0.052 | $0.1 |
Cryptopolitan’s ACH price prediction
According to Cryptopolitan’s predictions, Alchemy Pay (ACH) is expected to grow significantly from 2024 to 2030. In 2024, ACH could range from $0.0187 to $0.0204, with an average of $0.0196. By 2029, ACH could range from $0.0811 to $0.0969, and by 2030, from $0.1132 to $0.1381, indicating strong long-term growth potential.
Alchemy Pay historic price sentiment

Source: Coinmarketcap
- Alchemy Pay (ACH) launched in September 2020 at around $0.02 but dropped to $0.01 by October. In August 2021, it surged after a Binance collaboration, reaching a high of $0.1975 but falling to $0.0981 by month-end and $0.0628 by September. A brief surge in November pushed it above $0.10, but it closed at $0.0919 due to market concerns.
- In 2022, ACH stayed around $0.06 in January but dropped to $0.0133 in May due to geopolitical tensions. It recovered to $0.0222 in July but declined again to $0.0153 by August.
- In 2023, ACH saw a rise, peaking at $0.049 between January and April, and hitting $0.0303 in June.
- In 2024, the price trended downward from May to June, reaching $0.0244. It fell further to $0.0145 in July. A brief rise in August pushed ACH to $0.0216, but it dropped again to $0.0166 by September.


