
Key takeaways
- AMP price predictions hint at a maximum price of $0.0046 by the end of 2024 while maintaining an average price of $0.0043.
- In 2027, the price of AMP will range between $0.0127 and $0.0155, with an average price of $0.0132.
- In 2030, AMP will range between $0.0366 and $0.0437, with an average price of $0.0377.
Amp (AMP) is a decentralized collateral token facilitating fast and secure payment transactions on the Flexa network. Amp’s purpose is to enhance the adaptability of cryptocurrencies for day-to-day payments by addressing the issues of potential fraud and slow-speed transactions of typical cryptocurrencies. Amp also helps users stake tokens without physically transferring them to a smart contract. This function makes Amp suitable for any form of value exchange, including digital payments, traditional currency exchange, loan distributions, real estate transactions, and more.
Will AMP reach new heights with more adoption as the network’s number of users increases? Let’s examine the Amp technical analysis and predictions.
Overview
| Cryptocurrency | Amp |
| Token | AMP |
| Price | $0.00390 |
| Market Cap | $314,531,150 |
| Trading Volume | $314,531,150 |
| Circulating Supply | 80,722,574,661 AMP |
| All-time High | $0.1211 June 16, 2021 |
| All-time Low | $0.0007946 Nov 18, 2020 |
| 24 High | $0.003911 |
| 24 Low | $0.003588 |
AMP price prediction: Technical analysis
| Metric | Value |
| Volatility | 6.06% |
| 50-Day SMA | $ 0.003994 |
| 200-Day SMA | $ 0.005774 |
| Sentiment | Bearish |
| Fear & Greed | 29 (Fear) |
| Green Days | 14/30 (47%) |
AMP price analysis: Bullish swing results in hike past $0.00390
TL; DR Breakdown
- AMP coin price analysis confirms an uptrend at $0.00390.
- Cryptocurrency has gained up to 6.87% of value today.
- AMP prices are seeking resistance around $0.00392 high.
On September 19, 2024, AMP price analysis revealed an upward trend for the cryptocurrency. Coin value has increased up to $0.00390 in the past 24-hours. This indicates a positive market sentiment, as an overall recovery of 6.87% was also received. The bulls remained on the leading end this week, earning much profit for the cryptocurrency.
AMP price analysis 1-day chart
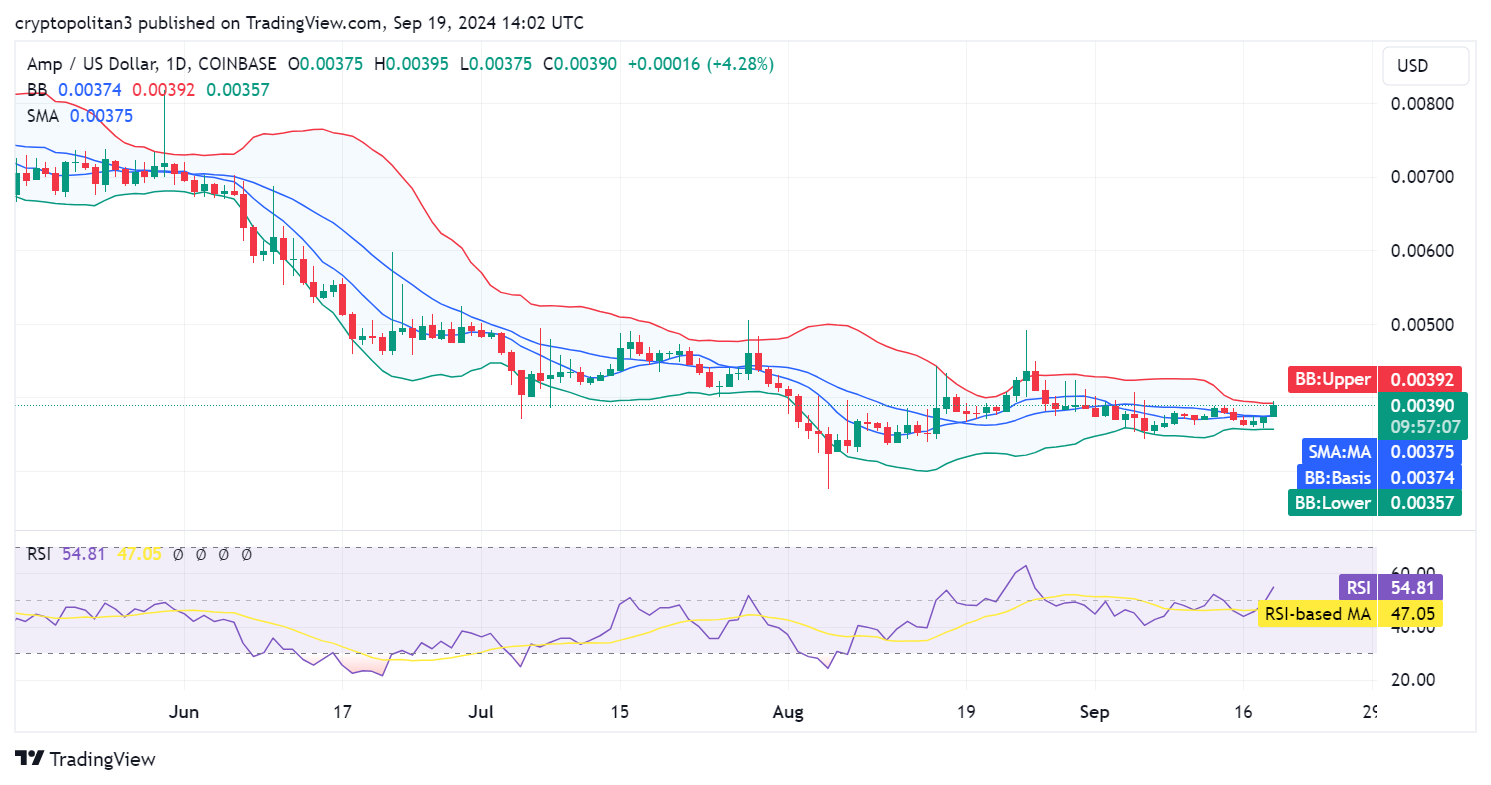
The 1-day price chart of AMP coin presents a highly bullish scenario regarding the ongoing market events. Coin value has enhanced up to $0.00390 high during the day. Side by side, the market sentiment remained towards the bullish side as well. The coin value has now stepped up beyond its moving average value.
The distance between the upper and lower ends of the Bollinger bands indicator confirms market volatility. As this distance seems unchanged, this indicates constant volatility. Moreover, the upper limit of the Bollinger bands indicator, acting as the resistance band, is at $0.00392. Whereas, its lower limit, serving as the support band, is at $0.00357.
The Relative Strength Index (RSI) indicator is moving upwards, considering the recent spike. Its value has improved up to 54.81 in the past 24-hours. The increasing movement of the RSI confirms a bullish trend. Moreover, the continual ascending curve on the RSI graph marks a positive market sentiment and therefore a balanced trading environment.
AMP/USD 4-hour price chart
The four-hour price analysis of AMP coin revealed an increasing trend for the cryptocurrency. Coin value has enhanced up to $0.00391 high in the past four hours. Green candlesticks on the four-hour price chart mark a strong bullish swing. As the volatility is on the rise, there is a higher chance of reversibility in the recent trends.
As the Bollinger bands are widening, the volatility levels are increasing. The increasing volatility is suggestive of a higher market unpredictability. Moving on, the upper limit of the Bollinger bands indicator, acting as support, is at $0.00386. Whereby, the lower limit of the Bollinger bands indicator, serving as another support, is at $0.00355.

The RSI value has soared up to the 68.03 limit during the day. In the past four hours, the upturn has resulted in massive improvement for RSI. The sharp ascending curve on the RSI graph confirms the strong bullish tide today. Side by side, this creates a period of stability within the market as reflected from the current price movements.
AMP technical indicators: Levels and action
Daily simple moving average
| Period | Value ($) | Action |
| SMA 3 | 0.003834 | SELL |
| SMA 5 | 0.003843 | SELL |
| SMA 10 | 0.003829 | SELL |
| SMA 21 | 0.003948 | SELL |
| SMA 50 | 0.003994 | SELL |
| SMA 100 | 0.004693 | SELL |
| SMA 200 | 0.005774 | SELL |
Daily exponential moving average
| Period | Value | Action |
| EMA 3 | 0.003887 | SELL |
| EMA 5 | 0.003859 | SELL |
| EMA 10 | 0.003796 | SELL |
| EMA 21 | 0.003815 | SELL |
| EMA 50 | 0.004187 | SELL |
| EMA 100 | 0.004846 | SELL |
| EMA 200 | 0.005168 | SELL |
What can you expect from the AMP price analysis next?
AMP price analysis for the day gives out a highly bullish prediction regarding the ongoing market events. Coin value has hiked up to $0.00390 in the past 24-hours. Side by side, the coin has achieved an overall recovery up to 6.87% today. This marks a period of stability within the market as the coin value continues to achieve new highs. Technical indicators as well as the price charts continue to support the bulls, reflecting the growing buying activities.
Is AMP a good investment?
AMP has been struggling with a bearish trend for the past few months. Despite this, its strong fundamentals suggest it could be a solid long-term investment. Crypto analysts suggest that the approaching weeks can steadily increase the cryptocurrency’s value. A bullish rally may be expected in the latter part of this year (2024), potentially pushing the AMP above $0.01.
Why is AMP up?
AMP’s price has increased today. Alternatively, the coin has experienced a gain of 6.87% if observed over the last 24 hours. The price is trading at $0.00390 as the coin is under a bullish spell for now and as the buyers sought victory in the past few hours.
Will AMP reach $0.010?
AMP’s resistance level is at $0.005; however, a break above this level is possible if sufficient buying momentum builds. A break near or above $0.010 will require a more robust push but isn’t impossible, as the coin achieved this level on March 12, 2024.
Will AMP reach $1?
Amp has never spiked above the $0.12 level. Even this price mark was observed only once at the start of the token’s launch, and AMP has never seen this level again. It seems highly unlikely for AMP to achieve $1 soon.
Will AMP reach $10?
According to Cryptopolitan’s price prediction, AMP will not achieve this level in the next 10 years until something unusual happens. Considering AMP’s current market cap of only $204 million, the scenario seems almost impossible.
Does AMP have a good long-term Future?
Amp is trading near its average price level if observed over the longest price period levels. It can be a good long-term investment, as its price will double in 2025 and reach $0.068 by 2030.
Recent news/opinions on AMP
- The Acronym Foundation announced that Anvil core contracts have been deployed on Mainnet. The network will facilitate governance proposals for launch in the coming weeks.
- After rebranding to Ampera, the Ampera Foundation is again rebranding to Acronym Foundation, focusing on developing two products: Anvil and Ampera. Anvil is a collateral protocol for issuing on-chain secured credit, while the Ampera project is a grassroots payments initiative to support mainstream digital payments.
AMP price prediction September 2024
Amp could break out lower from current levels. A break below 40 RSI will necessitate a steep reversal. This month, Amp will trade between $0.00357 and $0.00414, with an average price of $0.0039.
| Month | Potential Low | Potential Average | Potential High |
| September | $0.00357 | $0.00390 | $0.00414 |
AMP price prediction 2024
For 2024, traders can expect a maximum price of $0.0046, a minimum price of $0.0041, and an average trading price of about $0.0043.
| Year | Potential Low | Potential Average | Potential High |
| 2024 | $0.0041 | $0.0043 | $0.0046 |
AMP price predictions 2025 to 2030
| Year | Potential Low ($) | Average Price ($) | Potential High ($) |
| 2025 | 0.0060 | 0.0062 | 0.0072 |
| 2026 | 0.0090 | 0.0092 | 0.0105 |
| 2027 | 0.0127 | 0.0132 | 0.0155 |
| 2028 | 0.0179 | 0.0186 | 0.0221 |
| 2029 | 0.0255 | 0.0262 | 0.0311 |
| 2030 | 0.0366 | 0.0377 | 0.0437 |
AMP price forecast for 2025
AMP price prediction for 2025 indicates a bullish trend for Amp, with the maximum price potentially reaching $0.0072. Conversely, the minimum price of the coin might stabilize at $0.0060, with an average trading price of $0.0062.
Amp (AMP) price prediction 2026
In 2026, based on current projections and technical analysis, AMP’s maximum price is anticipated to reach $0.0105. The minimum price could be around $0.0090, with an average trading price of $0.0092.
Amp coin price prediction 2027
According to the AMP price prediction for 2027, the maximum price is expected to surge to $0.0155. The minimum price could be around $0.0127, with an average trading price of $0.0132.
Amp price prediction 2028
AMP price prediction for 2028 suggests a maximum price of $0.0221. The minimum price is projected to be $0.0179, with an average trading price of $0.0186.
Amp (AMP) price prediction 2029
For 2029, the maximum price of AMP is predicted to reach approximately $0.0311. The minimum price is expected to be $0.0255, with an average trading price of $0.0262.
Amp price forecast 2030
The AMP price forecast for 2030 suggests a maximum token price of $0.0437. The minimum price is projected at $0.0366, with an average trading price of $0.0377.

AMP market price prediction: Analysts’ Amp price forecast
| Firm Name | 2024 | 2025 |
| Wallet Investor | $0.0102 | $0.0592 |
| DigitalCoinPrice | $0.0158 | $0.0184 |
Cryptopolitan’s AMP price prediction
We expect AMP to achieve a high of $0.0044 in the second half of 2024. In 2025, the coin will range between $0.0057 and $0.0068, with an average of $0.0059. Note that the predictions are not investment advice. Seek independent professional consultation or do your research for investments.
AMP historic price sentiment
- The AMP token was officially launched on September 11, 2020, with an initial price of $0.009. In its early months, AMP experienced a downward trend, hitting an all-time low of roughly $0.0007 on November 17 of the same year.

- However, the token reversed its fortunes entering 2021. It surpassed its launch price, reaching a notable high of about $0.046 on February 14, 2021. The momentum continued, and by April 18, AMP’s price peaked at $0.064.
- AMP set new records, reaching a high of $0.077 on May 7, 2021, and then $0.12 on June 16, following its listing on the prominent cryptocurrency exchange, Coinbase.
- Despite these spikes, the overall trend for the rest of the year was bearish. By September 2021, AMP had fallen below the $0.05 mark.
- In January 2022, AMP declined further to $0.02. The bear market proved challenging, and by June of that year, AMP’s price had fallen below its initial launch price. On September 7, it hit a 52-week low of $0.0054.
- In 2023, AMP attained a maximum price of $0.00642 and a minimum price of about $0.00146. Near the end of the year, AMP was trading at $0.0035.
- At the start of 2024, AMP gradually started its bullish cycle and reached $0.0056. On March 13, it peaked at $0.0129 before reversing.
- For May, June, and July, the AMP token continued its slow descent from the $0.0081 level to reach $0.0040, almost losing 40% of its value in three months.
- At the start of August 2024, AMP continued following the downtrend, reaching $0.0031, but made high spikes, leveling back to $0.00342 on August 25.
- In September 2024, the AMP token traded between $0.00370 and $0.00396.


 trust for accredited investors 10")

