
Key takeaways
- Fantom price prediction suggests an average market price of $0.84 by the end of 2024.
- Holders can anticipate a maximum price of $1.76 in 2027.
- By 2030, FTM might touch $2.84.
The crypto market has been a nurturing ground for innovative and ambitious projects, which have introduced significant changes to its landscape by providing unique offerings. Among these, Fantom stands out as a protocol with the potential to transform the DeFi sector through smart contracts.
The FTM token enables interoperability among all global transaction platforms. Notably, the platform utilizes the “Direct Acyclic Graph” (DAG) smart contract platform, enhancing the network’s scalability.
The FTM incentive program’s unique advantages have attracted marketers’ attention, sparking curiosity about whether the FTM price might reach the $1 milestone in 2024. If you’re an investor with an interest in FTM, you’re in the right place as we delve into its potential price trajectory for 2024 and beyond.
Overview
| Cryptocurrency | Fantom |
| Token | FTM |
| Price | $0.6358 |
| Market Cap | $1,782,647,562 |
| Trading Volume | $228,282,624 |
| Circulating Supply | 2,803,634,836 FTM |
| All-time High | $3.48 on Oct 27, 2021 |
| All-time Low | $0.001953 on March 12, 2020 |
| 24-h High | $0.6828 |
| 24-h Low | $0.6334 |
Fantom price prediction: Technical analysis
| Volatility | 17.08% |
| 50-Day SMA | $ 0.44322 |
| 14-Day RSI | 68.42 |
| Green Day | 16/30 (53%) |
| Sentiment | Bullish |
| Fear & Greed Index | 50 (Neutral) |
| 200-Day SMA | $ 0.581135 |
Fantom price analysis
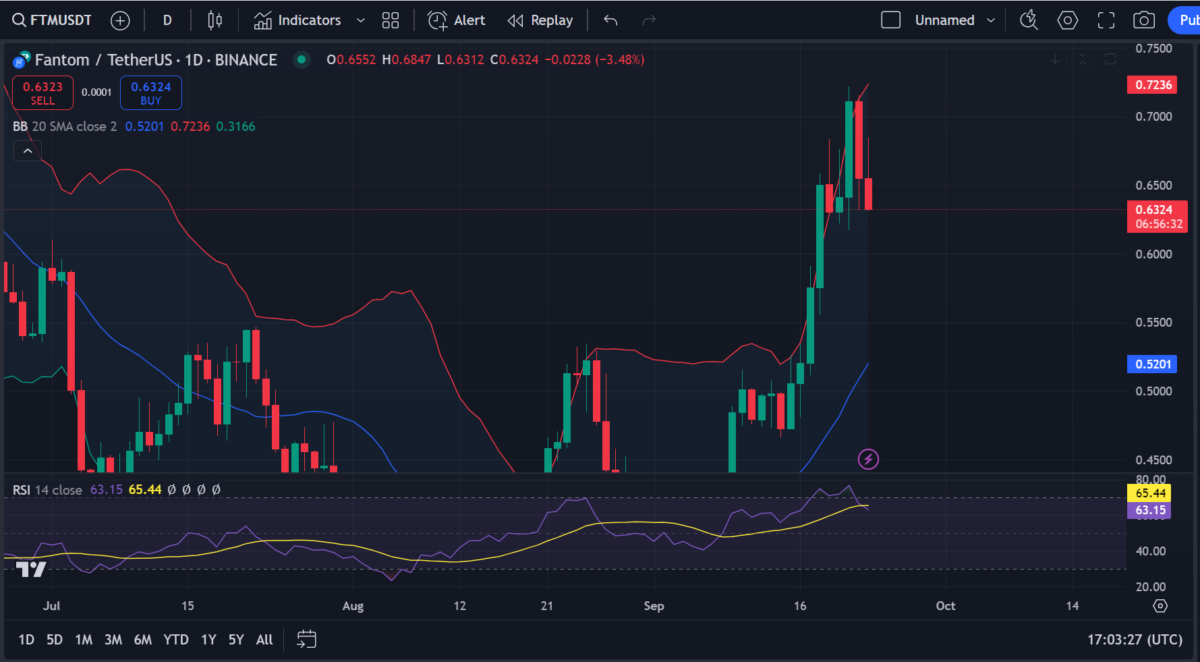
Fantom price analysis 1-day chart
On September 23, the 1-day chart for Fantom (FTM/USDT) shows a price of $0.6324, currently down by 3.48%. The chart displays a pullback after reaching a high of $0.7236. The Bollinger Bands indicate increased volatility, with the price nearing the lower band.
The RSI (Relative Strength Index) is at 65.44, signaling that the asset is close to overbought territory but remains below 70. A downward correction may continue if the RSI declines further, though strong resistance levels at $0.72 and support near $0.52 should be monitored for potential price reactions.
FTM/USD technical analysis 4-hour chart

The 4-hour chart for Fantom (FTM/USDT) shows the price at $0.6325, with a 1.48% decline over the current session. The Balance of Power (BoP) indicator reads -0.62, signaling a bearish dominance in the market.
The MACD (Moving Average Convergence Divergence) shows the blue MACD line at 0.0098, crossing below the signal line at 0.0160, indicating a bearish crossover. This suggests a weakening bullish momentum. The price has hovered between $0.63 and $0.65, showing consolidation with a potential bearish breakdown if momentum favors sellers. Key support lies near $0.60.
Fantom technical indicators: Levels and action
Daily simple moving average (SMA)
| Period | Value | Action |
| SMA 3 | $ 0.551742 | BUY |
| SMA 5 | $ 0.587158 | BUY |
| SMA 10 | $ 0.548919 | BUY |
| SMA 21 | $ 0.494322 | BUY |
| SMA 50 | $ 0.44322 | BUY |
| SMA 100 | $ 0.474406 | BUY |
| SMA 200 | $ 0.581135 | BUY |
Daily exponential moving average (EMA)
| Period | Value | Action |
| EMA 3 | $0.50259 | BUY |
| EMA 5 | $0.468943 | BUY |
| EMA 10 | $0.429729 | BUY |
| EMA 21 | $0.409074 | BUY |
| EMA 50 | $0.443566 | BUY |
| EMA 100 | $0.512541 | BUY |
| EMA 200 | $0.54394 | BUY |
What can you expect from the FTM price analysis next?
Based on the 1-day and 4-hour charts, Fantom (FTM) appears to be in a consolidation phase, with the price hovering around $0.63. The 1-day chart’s RSI near 65 indicates slightly overbought conditions, suggesting potential for a further pullback or sideways movement. The MACD on the 4-hour chart shows a bearish crossover, while the Balance of Power is negative, reflecting bearish sentiment. Overall, the price may test support around $0.60 if downward pressure continues. A break above $0.65 could signal bullish momentum, but consolidation or slight retracement seems likely in the short term.
Is Fantom a good investment?
The projection for Fantom’s value looks optimistic. It’s anticipated that the price of FTM could soon embark on an upward trend. We gently suggest you conduct thorough research before investing in any financial instrument.
Can Fantom rise?
It is projected that by the end of this year, the mean price of Fantom could hit average price $0.51. Looking at a five-year forecast, this cryptocurrency is expected to escalate to $2.56 potentially. Given the volatile nature of the market, it’s crucial to conduct thorough research before investing in any project, network, or asset
Will Fantom reach $10?
Based on forecasts derived from technical evaluations, it’s projected that FTM could hit double digits in the next ten years. It’s important to note that Fantom’s highest price ever was $3.48, attained in the latter part of October 2021.
Is Fantom a safe network?
Certainly, the network is secure because it utilizes a custom version of the Proof-of-Stake algorithm.
Recent news/opinion on Fantom
Sonic Labs has launched the Sonic Gems and Sonic Boom bounty program, allocating 37.5% of its $190.5M airdrop, approximately $28M, to Sonic Gems holders. This marks a significant initiative for app development.
Fantom recently launched SONIC Labs across all platforms on its protocol as it moves towards releasing SONIC. According to Fantom, SONIC is the fastest EVM Chain with a secure gateway to Ethereum.
In a statement released on the 1st of July, 2024, Fantom Foundation announced that the 3rd proposal for the upcoming #thesonicchain has passed. In the statement, the foundation said “as we continue to build out the new Sonic network, the Fantom Foundation has allocated up to 200,000,000 $FTM from its treasury to the Sonic Labs Innovator Fund 29 to support dApp growth, various business development initiatives, and worldwide adoption”.
Fantom price prediction September 2024
The Fantom price is likely to remain stable throughout September.
| Period | Potential Low ($) | Average Price ($) | Potential High ($) |
| Fantom price prediction September 2024 | $0.38 | $0.38 | $0.38 |
FTM price prediction 2024
By 2024, Fantom’s average market price is expected to be $0.81, with a potential low of $0.34 and a potential high of $0.84.
| Period | Potential Low ($) | Average Price ($) | Potential High ($) |
| Fantom price prediction 2024 | $0.34 | $0.81 | $0.84 |
Fantom price predictions 2025 – 2030
| Year | Potential Low ($) | Average Price ($) | Potential High ($) |
| 2025 | $0.82 | $0.91 | $1.00 |
| 2026 | $1.13 | $1.33 | $1.39 |
| 2027 | $1.47 | $1.65 | $1.76 |
| 2028 | $1.47 | $1.65 | $1.76 |
| 2029 | $1.82 | $1.96 | $2.07 |
| 2030 | $2.59 | $2.77 | $2.84 |
Fantom price prediction 2025
Fantom network is expected to continue its upward trend in 2025, potentially reaching an all-time high of $1.00. However, there could be fluctuations, and the FTM coin price might dip to $0.82, with an average price of around $0.91.
Fantom price prediction 2026
As for 2026 Fantom prediction,FTM market price is expected to peak at $1.39. However, it might fall to $1.13, with an average of $1.33.
Fantom price prediction 2027
The forecast speculated that Fantom’s price might hit a new all-time high of $1.76 by 2027. On the lower end, corrections may pull the price to $1.47, with an expected average trading price of around $1.65.
Fantom price prediction 2028
In 2028, Fantom’s market price might stabilize at $1.76 while maintaining the same average trading price of around $1.65, the same as in 2027.
Fantom price prediction 2029
Fantom is expected to reach an all-time high of $2.07 by 2029. However, it could fall to $1.82, with an average price of $1.96.
Fantom price prediction 2030
At the end of this decade, 2030, Fantom is projected to hit a high of $2.84. In the event of a price correction, it could drop to $2.59, with an average of $2.77.

Fantom market price prediction: Analysts’ FTM price forecast
| Firm Name | 2024 | 2025 |
| Changelly | $0.53 | $0.71 |
| Coincodex | $1.07 | $1.36 |
Cryptopolitan’s Fantom (FTM) price prediction
Cryptopolitan predicts that Fantom (FTM) will experience moderate price fluctuations in 2024. The average price is expected to be around $0.81. The price could potentially fall to a low of $0.34 or reach a high of $0.84. This forecast indicates a balanced outlook for Fantom, with potential for both growth and risk. Investors should consider these possible price ranges, which reflect the inherent volatility of the cryptocurrency market and suggest a cautious but optimistic perspective for the coming year.
Fantom (FTM) historic price sentiment

- Fantom (FTM) launched its mainnet in December, with initial trading prices mostly below $0.02 in 2019.
- FTM experienced gradual growth, staying under $0.05 for most of 2020 but reaching around $0.017 to $0.02 by December due to growing DeFi interest.
- Prices surged from $0.02 in January 2021 to $3.48 by October, driven by DeFi adoption and positive market sentiment. The year ended with a correction to around $2.30.
- In 2022, FTM faced significant fluctuations due to macroeconomic factors, with prices dipping below $0.50 mid-year. Despite recovery attempts, bearish trends dominated.
- Early volatility in 2023 saw prices around $0.40, recovering to $0.55 mid-year before settling between $0.45 and $0.50 by year-end.
- In early 2024, FTM surged from around $0.31 in January to above $1.00 by March, driven by strong bullish momentum and increased trading volumes. After peaking in March, the price corrected, dropping to lower highs and lows by April.
- Following the correction, FTM found support around $0.60 in May and entered a consolidation phase between $0.50 and $0.80 in June. Despite volatility and tests of the $0.50 support, it held firm.
- Fantom declined a bit in August, reaching low levels. Fantom reached $0.42 by Aug 28. Currently, in September, FTM traders around $0.4208


