
Key takeaways:
- Pendle is currently priced at $3.38 and is projected to reach a maximum of $6.88 by 2024, indicating a significant potential increase in its value (usd price update shows).
- In 2027 the price of Pendle is predicted to reach a maximum of $14.40.
Pendle (PENDLE) is innovating the DeFi space by enabling future yield trading. This unique approach helps users maximize returns through advanced smart contracts and seamless integration with other DeFi platforms.
Pendle’s recent progress, such as smart contract updates and strategic partnerships, marks its growth and commitment to innovation. Will these developments increase the value of $PENDLE? How will market changes and regulations affect its growth? Can Pendle reach $10?
Overview
| Token | PENDLE |
| Price | $3.64 |
| Market Cap | $578,425,184 |
| Trading Volume | $111,497,005 |
| Circulating Supply | 159,086,671 PENDLE |
| All-time High | $7.52 (Apr 11, 2024) |
| All-time Low | $0.03349 (Nov 09, 2022) |
| 24-hour High | $3.76 |
| 24-hour Low | $3.34 |
Pendle price prediction: Technical analysis
| Metric | Value |
| Price Prediction | $ 9.39 (165.69%) |
| Volatility | 7.80% |
| 50-day SMA | $ 3.03 |
| 14-Day RSI | 59.42 |
| Sentiment | Neutral |
| Fear & Greed Index | 54 (Neutral) |
| Green Days | 19/30 (63%) |
| 200-Day SMA | $ 3.96 |
Pendle price analysis
TL;DR Breakdown
- Pendle price analysis is neutral today.
- PENDLE is facing resistance at $3.7.
- Support for PENDLE is present at $2.5.
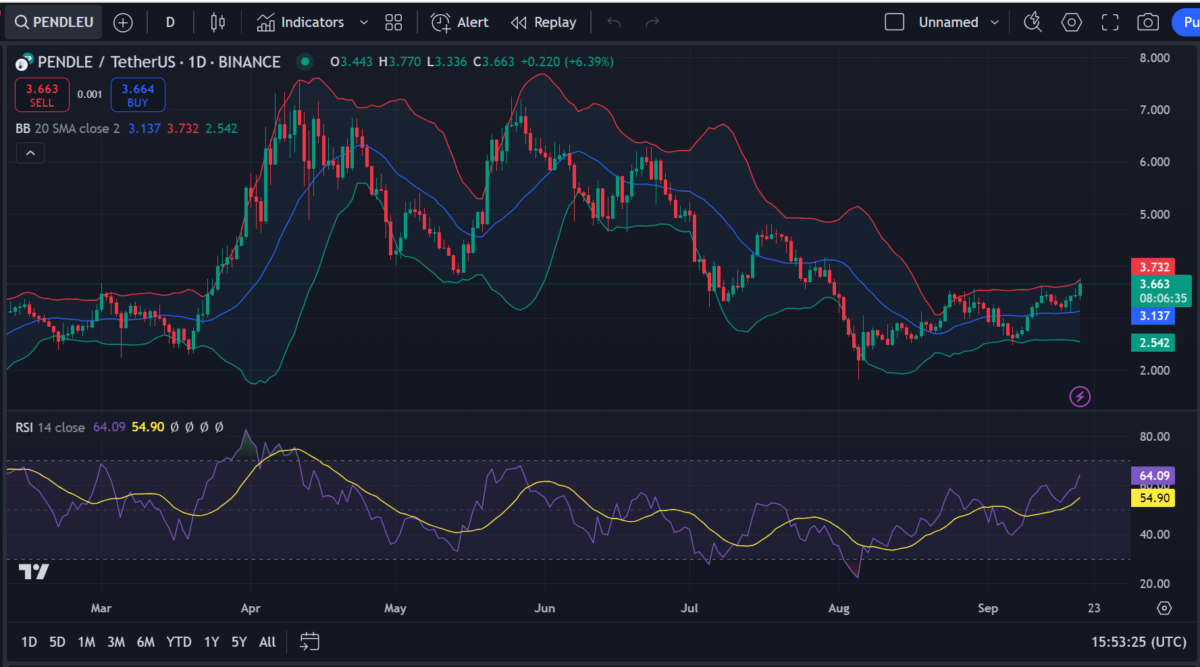
PENDLE/USD 1-day chart
On September 20, the 1-day chart for Pendle (PENDLE/USDT) on Binance shows a price of $3.66, with Bollinger Bands indicating potential volatility. The price is near the upper band, suggesting possible resistance at $3.73, while support is visible at $3.13 and $2.54. The RSI is at 64.09, showing a neutral trend but rising toward overbought territory as it nears 70.00. The price has broken through short-term resistance and is attempting to maintain momentum, though caution is warranted as the Bollinger Bands widen, signaling increasing volatility. A break above $3.73 may lead to further upside.
PENDLE/USD 4-hour chart

The 4-hour Pendle (PENDLE/USDT) chart on Binance shows a price of $3.66. The MACD indicates a bullish momentum, with the MACD line (0.078) crossing above the signal line (0.050) and increasing green histogram bars. The Balance of Power (0.54) suggests that buyers are gaining control. The price attempts to break recent resistance levels near $3.77, with support around $3.53. The increasing bullish signals on shorter timeframes suggest potential further upside, but the strong resistance at $3.77 may need to be cleared for continued upward movement.
Pendle technical indicators: Levels and action
Daily simple moving average (SMA)
| Period | Value ($) | Action |
| SMA 3 | $ 3.21 | BUY |
| SMA 5 | $ 3.14 | BUY |
| SMA 10 | $ 2.26 | BUY |
| SMA 21 | $ 3.16 | BUY |
| SMA 50 | $ 3.03 | BUY |
| SMA 100 | $ 3.78 | SELL |
| SMA 200 | $ 4.96 | SELL |
Daily exponential moving average (EMA)
| Period | Value ($) | Action |
| EMA 3 | $ 3.13 | BUY |
| EMA 5 | $ 3.05 | BUY |
| EMA 10 | $ 2.95 | BUY |
| EMA 21 | $ 2.99 | BUY |
| EMA 50 | $ 3.47 | BUY |
| EMA 100 | $ 3.95 | SELL |
| EMA 200 | $ 3.86 | SELL |
What can you expect from PENDLE price analysis next
Based on both the 1-day and 4-hour Pendle (PENDLE/USDT) charts, the price currently stands at $3.66, showing upward momentum. The 1-day chart indicates potential resistance around $3.73, while support is at $3.13 and $2.54. The RSI is neutral but rising, suggesting that the price may head toward overbought conditions. On the 4-hour chart, the MACD shows a bullish crossover, signaling continued momentum. However, there is caution as the price approaches resistance. If Pendle breaks above $3.73, further gains can be expected. Failure to break this resistance could lead to short-term consolidation or pullback.
Is PENDLE a good investment?
Investing in Pendle coin offers a unique opportunity in the DeFi sector. Pendle’s approach to tokenizing and trading future yields allows for flexible management of yield-bearing assets, enhancing investment portfolios. Conducting own research is crucial for potential investors to understand the Pendle market cap and the dynamics of its price movement.
Pendle’s ecosystem shows strong community trust, with impressive TVL, market cap growth, and endorsements from industry veterans like Arthur Hayes. These factors and high yields make Pendle a compelling investment in innovative DeFi projects.
Will Pendle recover?
Pendle experienced a sharp decline from $3.83 to $3.70, followed by a slight upward movement. This suggests potential for short-term recovery, but sustained positive market sentiment is needed for a full rebound. Observing the price movements over the coming weeks will provide more insights.
Will Pendle reach $10?
Pendle’s price is around $3.70, and given its recent downward trend, reaching $10 would require significant and sustained positive developments. While not impossible, it seems unlikely in the near term. However, historical trends show that favorable market conditions could have influenced Pendle’s rise.
Will Pendle reach $100?
Pendle price is recent downward trend, it is highly unlikely that Pendle will reach $100 in the foreseeable future.
Does Pendle have a good long-term future?
PENDLE has shown volatility and recent downward movement. Its short-term outlook appears uncertain. However, its long-term future could be positive if the project innovates, gains wider adoption, and maintains strong community and developer support.
Recent news/opinion on Pendle
According to DefiLlama, Pendle offers the highest APY for Bitcoin across the Etherverse, meaning that eBTC holders can get a 32.8% boosted APY.
Also, Pendle revealed that it has finally entered the liquid staking protocol ether.fi.
Pendle price prediction September 2024
Pendle could experience an uptrend in September, reaching $3.13 at the end of the month. The minimum price projected for the token is around $3.13. On average, traders and investors can expect $PENDLE to trade at $3.13.
| Pendle price prediction | Potential Low | Average Price | Potential High |
|---|---|---|---|
| Pendle price prediction September 2024 | $3.13 | $3.13 | $3.13 |
Pendle price prediction 2024
The price of Pendle is expected to reach a minimum level of $2.79 in 2024. The price of $ PENDLE can reach a maximum level of $6.88, with an average price of $6.37 throughout 2024.
| Pendle Price Prediction | Potential Low | Average Price | Potential High |
|---|---|---|---|
| Pendle price prediction 2024 | $2.79 | $6.37 | $6.88 |
Pendle price prediction 2025-2030
| Year | Minimum price | Average price | Maximum price |
|---|---|---|---|
| 2025 | $6.74 | $7.80 | $7.92 |
| 2026 | $9.22 | $11.00 | $11.30 |
| 2027 | $12.02 | $13.19 | $14.40 |
| 2028 | $12.02 | $13.19 | $14.40 |
| 2029 | $14.85 | $16.59 | $17.21 |
| 2030 | $21.15 | $23.40 | $23.40 |
Pendle price prediction 2025
The price of Pendle is predicted to reach a minimum value of $6.74 in 2025. $PENDLE could reach a maximum value of $7.92 and an average trading price of $7.80.
Pendle price prediction 2026
In 2026 the price of Pendle is predicted to reach a minimum level of $9.22. $PENDLE’s price can reach a maximum level of $11.30 and an average trading price target of $11.00.
Pendle price prediction 2027
In 2027, the average price of Pendle is predicted to reach a minimum level of $12.02. $PENDLE’s price can attain a maximum level of $14.40 and an average trading price of $13.19.
Pendle price prediction 2028
The PENDLE price prediction for 2028 projects a minimum price of $12.02 for the token. According to the analyst forecast, the token could reach a maximum price of $14.40 and an average trading price of $13.19.
Pendle price prediction 2029
The price of Pendle is predicted to reach a minimum value of $14.85 in 2029. Per the predictions, holders can expect a maximum price of $17.21 and an average trading price of $16.59
Pendle price prediction 2030
The Pendle price forecast for 2030 projects a minimum price of $21.15, a maximum price of $23.49 and an average forecast price of $23.40.

Pendle market price prediction: Analysts’ $PENDLE price forecast
| Firm | 2024 | 2025 |
|---|---|---|
| Coincodex | $ 8.43 | $ 14.98 |
| DigitalCoinPrice | $ 6.9 | $ 7.9 |
Cryptopolitan’s $PENDLE price prediction
According to our Pendle price forecast, the coin’s market price might reach a maximum value of $6.88 by the end of 2024. Looking forward to 2026, the value of Pendle could surge to a new all-time high (ATH) of $11.30.
Pendle historic price sentiment

- In September 2020, the price of Pendle started at around $1.0849, and a gradual decline followed.
- Between October and December 2020, the price decreased steadily, ending the year below $1.0.
- Between January and June 2021, the price remained relatively stable, fluctuating around the $0.90 to $1.0 range.
- Between July and December 2021, Pendle continued to exhibit minor fluctuations, maintaining a range around the $1.0 mark but showing no significant upward or downward trend.
- The price of Pendle from January to December 2022 remained relatively flat, hovering around the $1.0849 mark with minimal fluctuations. There was little to no significant upward or downward movement during this period.
- In June 2023, the price remained stable, with slight declines observed but staying well below the $1.0 mark. The price showed no significant upward momentum and maintained a steady range.
- Starting from mid-2023, the price began to show slight upward movements, though it was still relatively low.
- By the end of December 2023, the price showed some initial signs of increase, moving closer to the $1.2 mark.
- $PENDLE saw significant growth in Q1 2024, hitting above $2.5 in January 2024, $3.2 in February, and $5.5 by the end of March.
- The positive momentum from Q1 2024 continued in Q2 2024. $PENDLE attained its ATH ($7.52) on April 11, 2024. The token retested its support at around $3.8 in mid-May but soon rebounded above $7 on May 20.
- $PENDLE closed at $6.8 in May 2024; in June 2024, the token traded within the $4.6 – $6.3 range.
- PENDLE is trading around $3 range in September.


